
Better Outcomes by Better Outcomz · Operations
See where the customer journey itself is creating poor outcomes.
When outcomes are poor, the frontline is usually the first place organisations look. Yet many failures originate in the journey itself - a confusing letter, a hand-off with no owner, a system step customers cannot complete. Interaction-level QA cannot see that, because the adviser did nothing wrong.
What Better Outcomes does here
See where the customer journey itself is creating poor outcomes.
Better Outcomes does not only assess frontline interactions. It can also help organisations identify where processes, systems, communications and customer journeys are creating avoidable friction.
Use recurring interaction patterns and journey evidence to identify where operational design may be contributing to poor outcomes.
- 01
Journey-stage outcome analysis
Pass rates by journey stage show where in the process outcomes deteriorate, independent of which adviser handled the call.
- 02
Friction from customer evidence
Recurring interaction patterns - repeated questions, chasing, abandonment - reveal the communications and steps customers struggle with.
- 03
Hand-off and commitment tracking
Commitments made in one interaction are followed through the CRM and later contacts, exposing the hand-offs that fail.
- 04
Change monitoring
After a process or communication change, outcomes at the affected stage are tracked so the improvement can be evidenced or revisited.
Walkthrough
One operations journey, step by step.
An operations director keeps hearing that advisers need more training, but suspects the problem is the annual statement letter. Details are illustrative; the screens are real.
Step 1 of 4
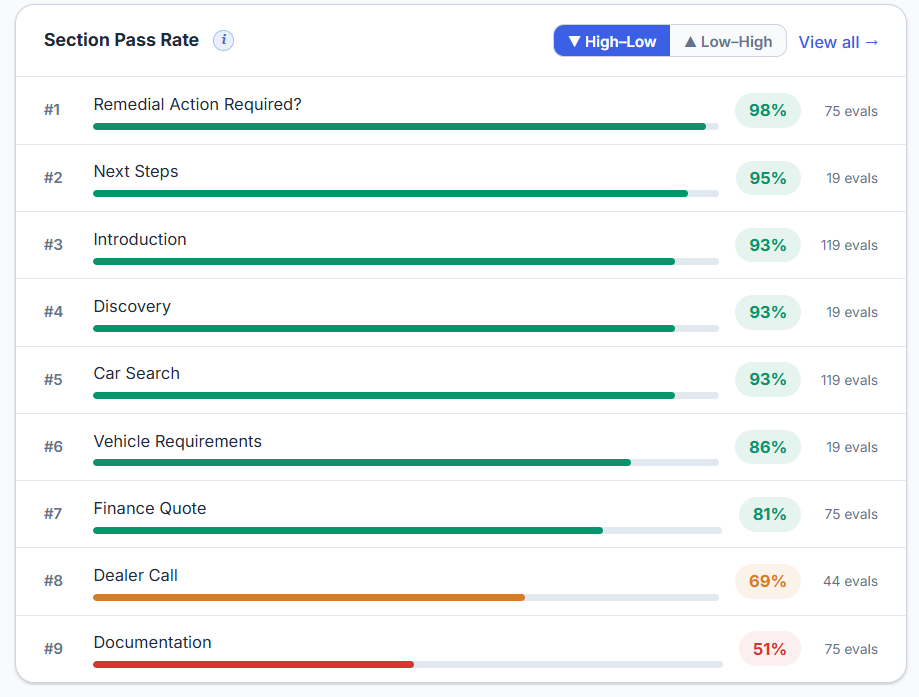
Outcomes are assessed by journey stage, not just by adviser
Pass rates by journey stage show that the stage following the annual statement mailing is where outcomes deteriorate, regardless of which adviser or team handles the call. The failure follows the process, not the people.
- Outcomes broken down by journey stage
- Process-driven failure separated from adviser behaviour
Step 2 of 4
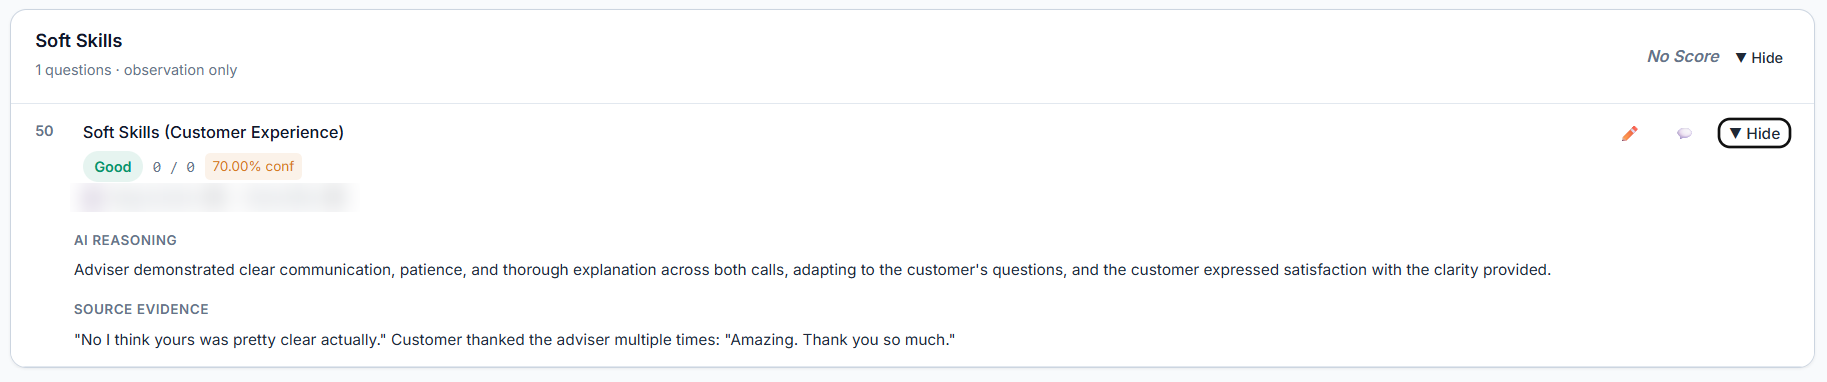
The recurring pattern is explained with evidence
Findings show customers asking the same three questions about the letter and advisers explaining the same paragraph on every call. The reasoning and verbatim evidence make the friction concrete for the journey design team.
- Recurring customer questions surfaced with evidence
- Friction described in the customer's own words
Step 3 of 4
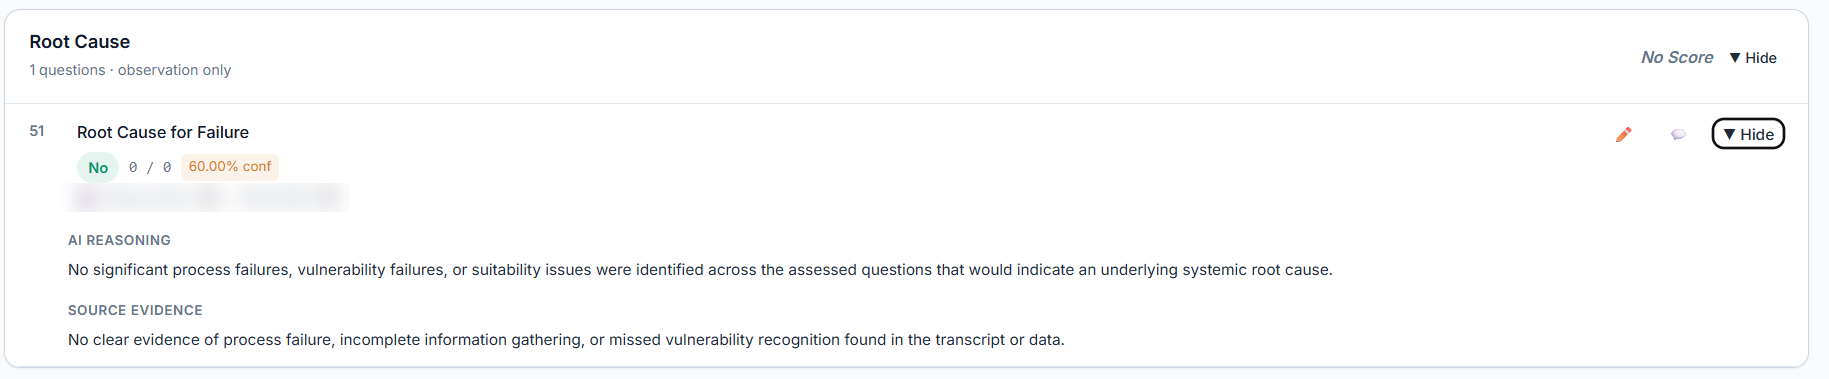
Root-cause assessment points at the communication
The potential root cause - an unclear letter creating avoidable contact and, for some customers, missed payments - is set out with its evidence and confidence for operations to confirm and act on.
- Potential root cause in the journey design, not the frontline
- Prioritised by how many customers are affected
Step 4 of 4
The letter is redesigned and the effect is monitored
After the redesign, the KPI view tracks outcomes at that journey stage and the contact volume it generates over the following cycle, so the operations director can evidence that the change worked - or revisit it.
- Outcomes monitored after the operational change
- Evidence for the change, not anecdote



In practice
What this looks like on a real journey.
- Example 01
Customers keep calling about the same letter
Interaction patterns show the questions the letter prompts. The fix is in the communication, not the adviser.
- Example 02
A digital step is silently failing
Journey evidence shows customers abandoning an online step and phoning instead, giving journey designers a prioritised improvement.
- Example 03
Proving a process change worked
Outcome pass rates at the redesigned stage are monitored before and after the change.
Illustrative scenarios · Findings are surfaced for human review, not decided automatically
The question this answers
“Which parts of the journey are creating friction?”
What your team gains
- Identify recurring customer journey friction
- Find process stages associated with poor outcomes
- Understand why customers repeat or abandon journey steps
- Highlight confusing communications or hand-offs
- Prioritise journey improvements using customer evidence
- Monitor outcomes following operational changes


Real Better Outcomes product screens · Shown with test data
AI assurance and explainability
AI you can evidence, not just trust.
The AI does not simply generate a score. It produces an assessment that a reviewer can check against the evidence used to reach it - and change if the evidence does not support it.
Your data
Customer data is not used to train public or general-purpose AI models. Products are hosted on UK infrastructure with access segregated by organisation, team and user.
Security and governance/ 01
Configurable outcome frameworks
Your outcome definitions, scorecards and rules - applied consistently across every connected interaction.
/ 02
Evidence behind every assessment
Each finding links to the interaction, CRM record and journey events it was drawn from.
/ 03
Explainable reasoning
The criteria applied and the reasoning followed are shown beside the evidence, not hidden in a score.
/ 04
Human-in-the-loop review
Reviewers confirm, reject, escalate or override - with authority to change the outcome and a recorded rationale.
/ 05
Confidence thresholds
Where applicable, low-confidence findings route to human review before any action is taken.
/ 06
Audit history
Findings, decisions, overrides and model versions are written to an append-only audit history.
/ 07
Configurable escalation
Route confirmed findings to remediation, coaching or compliance queues according to your governance model.
/ 08
Role-based access
Named permissions by organisation, team and role, with MFA and lifecycle management.
/ 09
Reporting and governance
Trend, calibration and override reporting for quality, operations, risk and Board oversight.
/ 10
Data controls
UK product hosting, tenant segregation and defined data scope agreed per deployment.
Frequently asked
Questions buyers ask us first.
- Isn't this just adviser monitoring software?
- No. Better Outcomes assesses the outcome the customer received, and many poor outcomes originate in the journey rather than the conversation. Pass rates by journey stage, hand-off tracking and recurring interaction patterns point to process, system and communication failures the adviser did not cause.
- How do we prioritise journey improvements with it?
- Recurring friction - repeated questions, chasing, abandoned steps - is quantified across the population with the evidence behind it, so journey designers can rank improvements by how many customers are affected and how severe the outcome is.
- Can we prove a process change worked?
- Outcome pass rates at the affected journey stage are tracked before and after the change, so the improvement can be evidenced or revisited using customer evidence rather than anecdote.
Insights for Operations teams
Thinking worth taking back to your team.
- Engineering7 min readAI didn't replace our engineers. It changed what they do.Christian Henson explains how AI coding tools are changing engineering work at Better Outcomz without replacing experienced judgement.Read the essay
- AI Governance9 min readAI adoption does not end at go-liveChristian Henson explains why enterprise AI needs evidence-led assurance from approval and operation through to monitoring and change.Read the essay
Working session
See Better Outcomes on your customer journey.
Bring one representative customer journey and we'll show how Better Outcomes could assess it across interactions, CRM evidence and customer outcomes. No customer data is required for the first session.